Driverless Transportation’s D20 Stock Index - 2014 In Review
The Driverless Transportation D20 Stock Index ended 2014 just short of where it started, despite the decline of the two stocks that most influence its value. The D20 was inaugurated on August 1st, 2014 with a value of 139.694, and finished the year at 136.843, for a loss of 28.506 or 2.04 percent. The D20 Index reached a high of 149.73 on September 5th,, and a low of 130.01 on October 17th.
Background
Driverless Transportation created the D20 Stock Index to provide a dynamic, quantifiable index to track a group of the most important publicly-traded companies worldwide in the driverless arena. The D20 Stock Index went live on August 1st last year and includes 20 stocks They are a combination of US stocks and the American Depository Receipts (ADRs) of companies based outside the US. The D20 Stock Index is calculated using the same methodology used in the calculation of the Dow Jones Industrial Average.
The D20 is well represented globally with company headquarters in nine different countries.
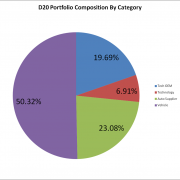
We’ve categorized the companies in the D20 into four different groups:
- Technology – Companies that create and license driverless technology (e.g. NVIDIA);
- Parts Supplier – Companies that historically have provided parts and subsystems to automobile (or vehicle) companies (e.g. Denso);
- Vehicle – Companies that design and market vehicles (e.g. Daimler AG)
- Technology OEM – Technology companies that have started designing their own driverless vehicles
Click on the images below to enlarge the view
.
2014 Winners and Losers
There were some significant winners and losers in the five months of 2014 that the D20 Stock Index was live. The largest percentage gainer, Blackberry (BBRY), starting from a small base, gained 18.4 percent to end the year at $11.01. The largest absolute gain in the D20 was by Visteon (VC), which gained $11.13 or 11.6 percent to close 2014 at $106.73. Other significant gainers were NVIDIA (NVDA), up $2.44 or 13.8 percent, and Mobileye (MBLY), which rose $4.25 or 11.5 percent.
In contrast, the largest absolute loser was Google (GOOG), which lost $37.06 or 6.5 percent to end the year at $529.01. The ADR shares of the Chinese vehicle company BYD Company LTD (BYDDY) was the biggest percentage loser ending the year at $8.15 for a loss of 36.6 percent. Other D20 component companies that had significant losses were the ADR of the Swedish Trucking Company, Volvo AB (VOLVY), which lost $1.36 or 11.1 percent to finish 2014 at $10.87, and Nissan’s ADR (NSANY) which lost $2.06 or 10.5 percent to end 2014 at $17.57
In general, the Technology and Part Supplier companies stocks outperformed the Vehicle Companies.
Comparison Against Other Indices
After its launch the D20 Stock Index tracked closely with the Dow Jones Industrials, the S&P 500 and the NASDAQ for about six weeks, when it begin to lose ground versus the other indices.
By the end of November, it began to track the other indices again but the damage had been done. It had lost about 10 percent of its value versus the other indices.
What Drives the D20 Stock Index?
There are two major drivers:
Two of the companies within the D20 Stock Index have significant influence over the index due to their stock price. Google’s stock price at $529.01 is 38.7 percent of the D20 and Tesla’s (TSLA) at $222.87, is 16.3 percent. At a combined 54.9 percent at the end of the year in 2014, Google and Tesla drive the D20 stock index.
There are two other related macroeconomic trends that are affecting the D20 Stock Index:
- Gasoline prices in the US have dropped 20 percent since the inception of the D20 Stock Index.
- Because of the gasoline prices and other world economic factors, the US Dollar has risen in value dramatically against most other currencies. 1 It is up 10 percent against a market basket of other currencies since the inception of the D20 Stock Index.
Fifty-five percent of the companies in the D20 Index use ADRs to trade on US exchanges in US dollars. When the dollar gets stronger those ADRs lose value. These two factors – the decline of Google and Tesla, and the rise of the dollar – were enough to send the D20 down over the past four months.