
Crash Avoidance Systems
Guy Fraker, AutonomouStuff
Early Autonomous (Active) Safety Technologies: The Early Numbers Are Dramatic
Throughout the past 100+ year history of vehicles and vehicle insurance, the relationship of crash frequency trends to crash severity trends has been remarkably consistent:
Rule #1: Changes in either are measured in single digits
Rule #2: Whenever frequency goes in one direction, severity per event moves in the opposite. i.e. when frequency (number of events) declines, the severity of the remaining crashes goes up.
The numbers in these studies reflect unprecedented disruption given double-digit improvements in both.
The numbers provided in these studies are from Auto Manufacturers with vehicles using one or more sensor based safety system that ALSO have statistically significant consumer use. These numbers represent insured claims involving coverages invoked by the operator of the owned vehicle with one or more of these systems. All other coverages have been excluded.
These numbers are significant in terms of general trends and in the comparisons of vehicle to vehicle. They will have to serve as proxies for larger commercial vehicles and municipal mass transit vehicles, as the deployment of sensor based safety systems is not yet statistically significant. However, a safe conclusion would be that improvements in frequency should be relatively consistent when applied to these other vehicle use cases. That said, improvements in severity per event should be magnified the larger the mass of the vehicle in question. Example: one of these systems reduces the damage incurred by the vehicle(s) involved in a crash by 23%. Now assume that same system is applied to a moving bus, or speeding ambulance- the expected reduction in frequency should be greater than 23%.
IMPORTANT NOTE: When crash severities are reduced, this translates into less damage, which will directly result in lower litigation costs, mitigation of driver related worker’s comp losses, long term disability expenses associated with a crash event. With time, the costs allocated to providing insurance, self, bond, or purchased, will also decline. Finally, with fewer events, and fewer high severity events, an unmeasured loss from business interruption, negative goodwill (PR) will be yet another benefit.
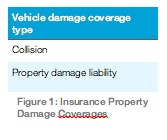
Vehicle Insurance generally provides 4 coverages to repair, or recover, damaged/loss of tangible physical property:
- Comprehensive- theft, vandalism, broken glass, animals, storm- NOT crash related, not included in these numbers
- Collision: Crash damage to the vehicle owned by the owner of the insurance policy: Common insured event
- Property Damage (PD): A liability coverage to repair/recover tangible physical property owned by someone other than the owner of the policy. Common insured event
- Uninsured/Underinsured Property Damage: Not an event caused by the owners of these technologies so not included in this study.
Vehicle insurance generally provides three of four coverages to protect/indemnify a policy owner against harm to a person :
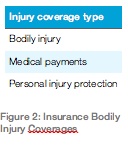 Bodily Injury Liability: Damage caused by the owner of the policy to another person, including cost of legal defense, settlement, and/or jury award up the limit stated in the policy
- Medical Payments: Coverage, up to a stated limit, per person, protection for the driver, family members, and/or other occupants.
- Personal Injury Protection (PIP) This coverage replaces BI & PD liability in those states with a “No-fault”Tort system. Some Medical Payments coverages and lost wages are also included in PIP coverage
- Uninsured/Underinsured Motorist: Additional coverage protecting the owner of the policy in the event that are involved in a crash caused by an uninsured driver. Not part of the studies, as these metrics are all based on the operation of an insured vehicle by the owner of the vehicle.
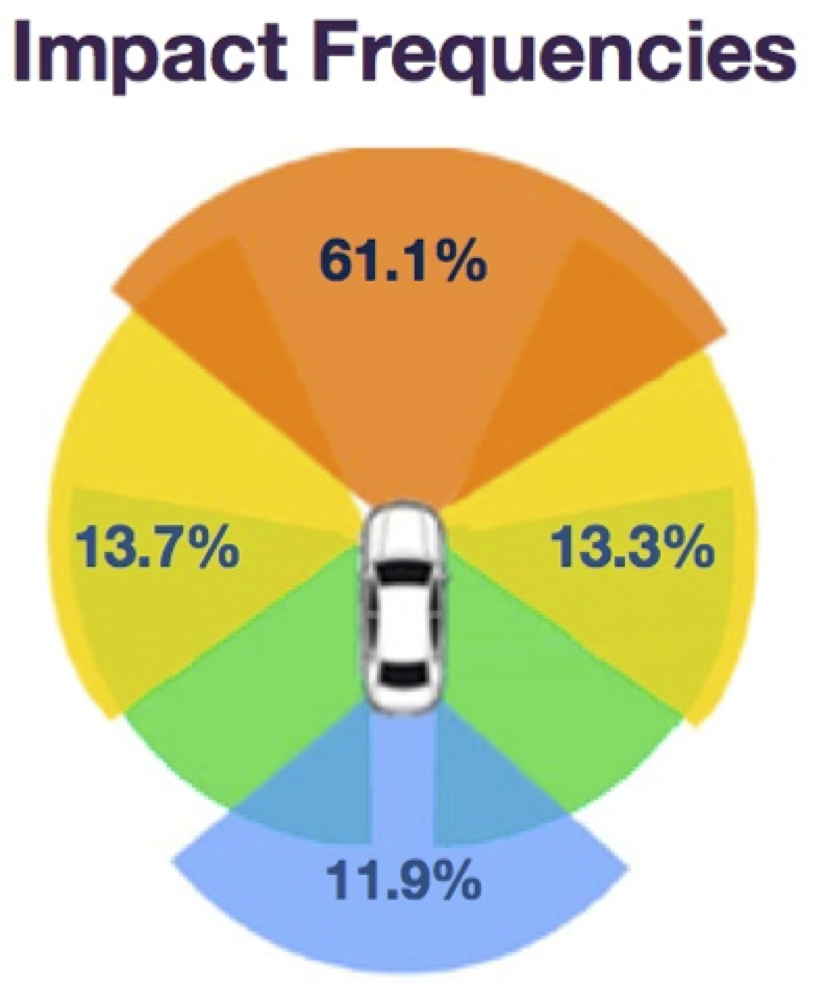
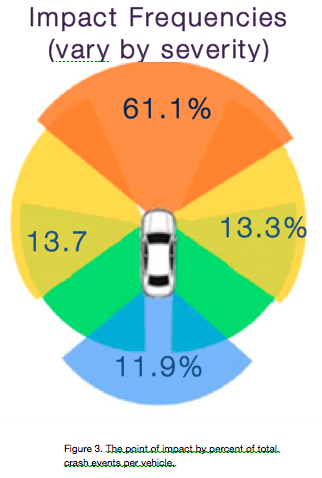
The starting line: How often is a specific location on a vehicle the point of impact in a crash?
How many more+/-fewer crash events were incurred by vehicles with one or more sensor-based safety system?
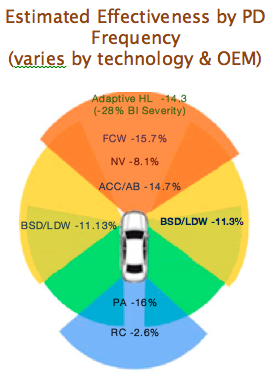
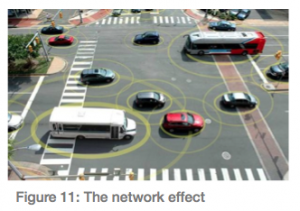
As figure 4 highlights, the impact upon accident frequency rates has thus far been very positive. One aspect that puts these figures into a more dramatic context is that they come from early adoption. What separates these technologies from all prior safety advances, is the compounding impact from what is known as the network effect. By increasing the situational awareness to a 360 degree field of view and simultaneously extending that field of view from an estimated 30 meters to 300 meters, the sensors on one vehicle essentially make the roads safer for the four to five vehicles operating immediately adjacent to the vehicle with the technologies. As more and more vehicles enter the fleet with these technologies, the benefits experience an compounding effect.
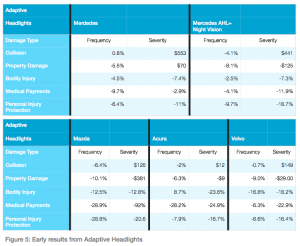
As this first table, Figure 5, indicates, a general category of technologies can yield what can also be generalized as a benefit. However, as the figures also clearly suggest, much more detailed analysis is needed on both the differences from auto manufacturer to auto manufacturer (OEM) in the technical attributes. However, equally important is the need for additional human factors research on the differences in the drivers from (OEM to OEM). i.e. are the owners of a Mercedes materially difference from the owners of a Mazda with respect to these vehicles?
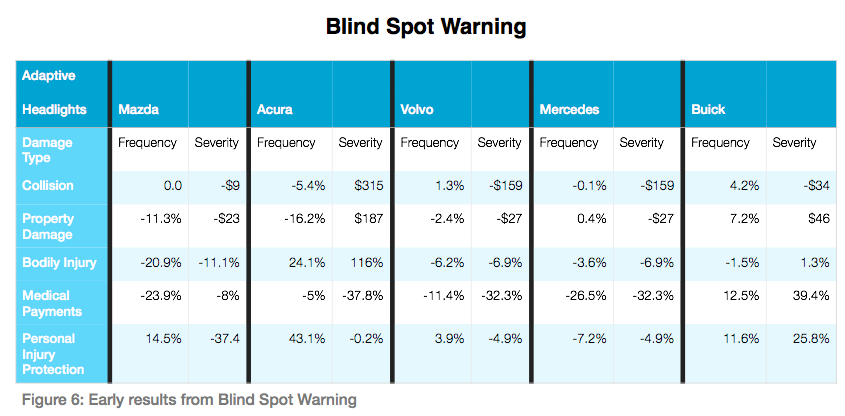
None of the technologies resulted in such a mixed set of results as the blind spot warning category. An important note is the difference in the technologies by OEM, as some provide a warning, some generate a haptic alert, while others are actual lane keeping technologies. Again, these results point towards benefits, but significant additional work must be done to determine if the technologies actually cause a driver to be less cautious.
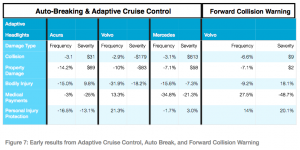
As with the other technologies reviewed, the variance from OEM to OEM is an area for further study. However, as a category of active safety systems, these are particularly important given the vast majority of crash impact points are on the front of a vehicle. The volume of double digit
declines from these technologies is particularly noteworthy.
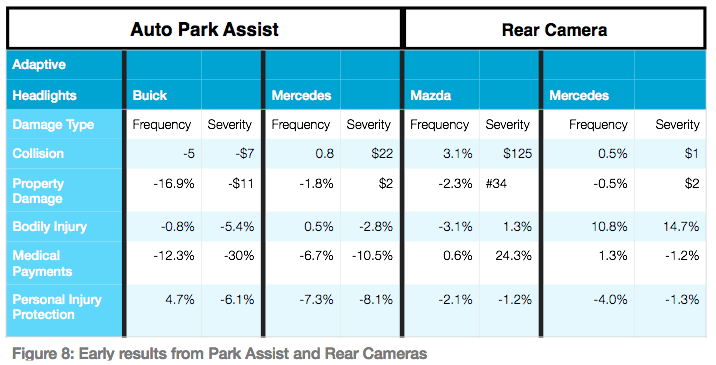
Figure 7 is a summary of early results in two crash prevention systems that are by and large applicable to very low speed incidents. As such, any dramatic improvements in any of the bodily injury coverages must be taken with a grain of salt, as the frequency of bodily injury claims incurred during a parking maneuver is quite low as a baseline.
In conclusion, the resulting crash frequency and severity improvements, in general is fairly significant compared to both past vehicle technologies and when compared to the historic experience of the insurance industry. The reason these numbers are so important is how they relate to standard insurance industry forecasts. This is a classic, living, in real time, case study of an industry relying upon historic assumptions, even in the face of evidence challenging those assumptions.
The tables that follow were published in 2012 and 2014 in leading Property & Casualty journals. The first set of tables appeared in the January 24, 2012 report published by the Insurance Institute for Highway Safety, in an article, “Estimated Time of Arrival”. The table in Figure 10, appeared in the trade journal Property Casualty 360, circulated in February 2014.
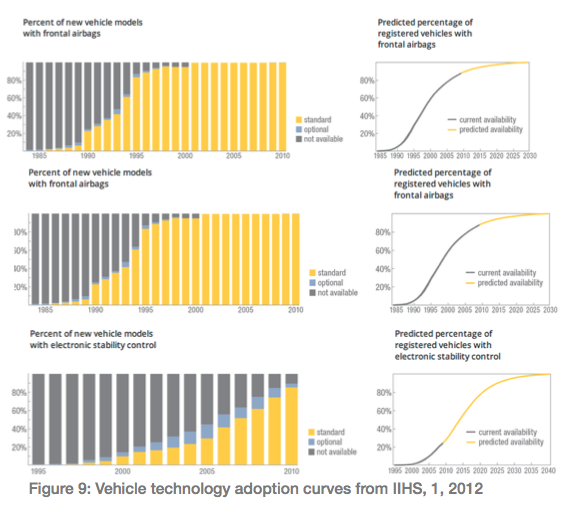
The cause and effect being made in these very well written reports is that the adoption of active, connected, cooperative technologies must be the same as all prior vehicle improvements in order to yield a measurable impact. However, such a conclusion ignores three fundamental facts relevant to the future more than the past. First, the pace of declining costs per unit is simply without precedent. Sensors with a suggested retail price of $20,000 in 201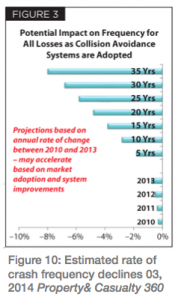 3 will retail for $200 in 2015. Second, these technologies do create a network effect that by itself will create a dramatic effect. In very simplistic terms, as Figure 11 highlights, 1 out of every 5 vehicles can positively impact accident frequency for all 5 if armed with these technological solutions. This would suggest, as published by the Texas Transportation Research Institute, that a 24% deployment could result in zero accident related stop & go congestion in most major urban environments. What if a 30% deployment were to were to prevent 60% of all crash events? According to the charts above, such a penetration into the fleet could be achieved within 15 years.
Third and finally, these forecasts ignore the the efforts, and successes, in developing aftermarket active safety systems. For example, when Harbrick, LLC debuted the Polysync vehicle OS for autonomy, they surprised quite a number in the automotive industry. Here was a plug & play OS capable of integratin g the data from any configuration of perception technologies connected to any vehicle and the product came from a firm of four located in Moscow Idaho. At the other end of the complexity and cost spectrum is the forward collision and lane departure warning application: iONROAD, see Figure 12. For $1.00 any consumer can download a fairly functional app, that includes navigation, telematics data for driver coaching, a dashboard camera, road departure and forward collision warning. Such a deployment model is not feasible with any of the vehicle technologies listed in IIHS article.
For the first time in the history of motorized mobility, double digit declines in crash frequency and severity are no longer theoretical, but being achieved. Never has the auto insurance industry faced double digit declines in both frequency and severity over such a brief period of time. The automated driving experience will be just that- more about the mobility experience. The impact on the insurance industry will have long since been made. The time to engage is now.
Guy Fraker: Founding CEO, get2kno, Inc. & Chief Learning Officer- AutonomouStuff, LLC
Author, inventor, entrepreneur, futurist, and innovation coach- Guy brings a unique perspective both provocative and inspirational. Guy has been on the leading edge of multiple transformations for over a decade. By sharing actual experiences, he brings authenticity to audiences and clients. Guy’s #1 objective is providing practical applications clients use to gain an understanding of scaled disruptions, then how to leverage the leverage or create emergent opportunities. As an entrepreneur Guy is dedicated to enabling access to products and services that empower as an alternative to ownership.

Guy has been featured in the NY Times, NBC, various Silicon Valley blogs, Thinking Highways magazine, and Forbes. and will appear in an upcoming documentary,“Life onWheels”. He has provided keynotes in the U.S., Canada, India, and Korea, guest lectures at Graduate Schools around the world. He has been engaged by auto manufacturer’s, U.S. and foreign governments, Fortune 100 firms, international trade associations, as well as startup entrepreneurs,Venture Capital firms, and not-for-profits such as The X-Prize Foundation. Guy is also the charter President for the Heartland Chapter of AUVSI, and holds BOD seats at several mobility not-for-profits. 
Singularity university
Executive Program, Emerging & Exponential Technologies!
2010 – 2010
University of Georgia - Terry College of Business
MBA, Behavioral Economics!
2001 – 2003
University of Wyoming
BA, History
1979 – 1983
http://www.linkedin.com/in/gfraker